Difference between revisions of "Cell sorting"
Simon Kahan (talk | contribs) (Created page with " Biocellion Studies Timings These are results from Testing Biocellion on the machine with the following details: CPU: Intel(R) Core(TM) i7-3770K CPU @ 3.50GHz Using: 4 thread...") |
Simon Kahan (talk | contribs) m |
||
| (15 intermediate revisions by 2 users not shown) | |||
| Line 1: | Line 1: | ||
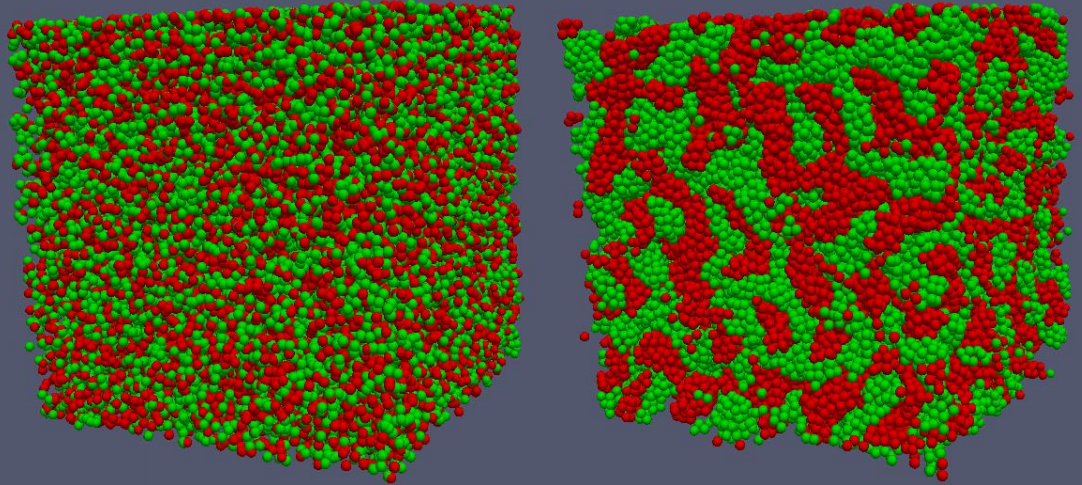
| − | + | Many multicellular patterns formed during morphogenesis and embryonic development arise because of differential adhesion among distinct types of disassociated cells <ref>Steinberg, Malcolm S. (1963). Reconstruction of Tissues by Dissociated Cells. ''Science'', '''141''', no. 3579, 401-408.</ref>. Simulations of this process have demonstrated how changes in homotypic and heterotypic adhesion can result in many distinct macroscopic cellular arrangements including clumping, where homotypic cells aggregate, or mosaics where heterotypic cells alternate forming checkerboard-like patterns <ref>Zhang, L., Wang, Z., Sagotsky, J. A., and Deisboeck, T. S. (2009). Multiscale agent based cancer modeling. ''Journal of Mathematical Biology'', '''58'''(4-5), 545–559.</ref>. In our test model, two different cell types are defined with each cell mapped to a sphere of diameter 8 ''μ<sub>m</sub>''. If there is an overlap between two neighboring spheres, the two cells push each other to remove the overlap (cell-cell shoving). In this demonstration, if two non-overlapping cells of a same type are within 10 ''μ<sub>m</sub>'' they pull towards each other modelling stronger adhesion. If they are of different types there is no additional attractive force. The simulations demonstrate that such differential adhesion leads to cell sorting into homotypic aggregations from an initial random distribution. | |
| + | [[File:sorting.png|500px|center|Cell sorting]] | ||
| − | + | The model code implemented using the Biocellion framework has 756 lines---the empty model code template has 650 lines. Biocellion users can simulate cell sorting using a cluster computer with just little more than 100 lines of coding. Evaluating pairwise interactions once for every cell pair within 10 ''μ<sub>m</sub>'' for 1.72 billion cells packed in a 10 ''μ<sub>m</sub>''* 10 ''μ<sub>m</sub>''* 10 ''μ<sub>m</sub>'' region takes approximately 20 seconds using 32 compute nodes (each node has two AMD Opteron 6272 Interlago 2.1 GHz sockets). | |
| − | |||
| − | |||
| − | |||
| − | + | <center> | |
| − | + | {{#ev:vimeo|88399915|400}} | |
| − | + | </center> | |
| − | + | <references> </references> | |
| − | |||
| − | |||
| − | |||
| − | |||
| − | |||
| − | |||
| − | |||
| − | |||
| − | |||
| − | |||
| − | |||
| − | |||
| − | |||
| − | |||
| − | |||
| − | |||
| − | |||
| − | |||
| − | |||
| − | |||
| − | |||
| − | |||
| − | |||
| − | |||
| − | |||
| − | |||
| − | |||
| − | |||
| − | |||
| − | |||
| − | |||
| − | |||
| − | |||
| − | |||
| − | |||
| − | |||
| − | |||
| − | |||
| − | |||
| − | |||
| − | |||
| − | |||
| − | |||
| − | |||
| − | |||
| − | |||
| − | |||
| − | |||
| − | |||
| − | |||
| − | |||
| − | |||
| − | |||
| − | |||
| − | |||
| − | |||
Latest revision as of 02:48, 7 September 2014
Many multicellular patterns formed during morphogenesis and embryonic development arise because of differential adhesion among distinct types of disassociated cells [1]. Simulations of this process have demonstrated how changes in homotypic and heterotypic adhesion can result in many distinct macroscopic cellular arrangements including clumping, where homotypic cells aggregate, or mosaics where heterotypic cells alternate forming checkerboard-like patterns [2]. In our test model, two different cell types are defined with each cell mapped to a sphere of diameter 8 μm. If there is an overlap between two neighboring spheres, the two cells push each other to remove the overlap (cell-cell shoving). In this demonstration, if two non-overlapping cells of a same type are within 10 μm they pull towards each other modelling stronger adhesion. If they are of different types there is no additional attractive force. The simulations demonstrate that such differential adhesion leads to cell sorting into homotypic aggregations from an initial random distribution.
The model code implemented using the Biocellion framework has 756 lines---the empty model code template has 650 lines. Biocellion users can simulate cell sorting using a cluster computer with just little more than 100 lines of coding. Evaluating pairwise interactions once for every cell pair within 10 μm for 1.72 billion cells packed in a 10 μm* 10 μm* 10 μm region takes approximately 20 seconds using 32 compute nodes (each node has two AMD Opteron 6272 Interlago 2.1 GHz sockets).
